Load average
In this use case, we configure the Wazuh agent to monitor the output of the Linux uptime command to measure the current load average of the system. The load average helps to keep track of the usage of system resources.
Configuration
Linux endpoint
We configure Wazuh agent on the Linux endpoint to monitor the load average output of the Linux uptime command and alert when it is higher than a given threshold. For this use case, we monitor when the load average threshold is higher than 2.
Perform the following steps on the Linux endpoint.
Append the following configuration to the Wazuh agent
/var/ossec/etc/ossec.conffile:<ossec_config> <localfile> <log_format>command</log_format> <command>uptime</command> <frequency>30</frequency> </localfile> </ossec_config>
Where:
The
commandvalue of the<log_format>tag specifies the output of the command is read as multiple eventsThe value
uptimeof the<command>tag specifies the command the Logcollector module executes.
Restart the Wazuh agent service to apply the changes:
$ sudo systemctl restart wazuh-agent
Wazuh server
Perform the following steps on the Wazuh server.
Add the following rules to the
/var/ossec/etc/rules/local_rules.xmlfile on the Wazuh server. The rule generates an alert when there is a load average higher than 2:<group name="load_average,"> <rule id="100017" level="7" ignore="7200"> <if_sid>530</if_sid> <match>ossec: output: 'uptime': </match> <regex>load average: 2.</regex> <description>Load average reached 2.</description> </rule> </group>
Restart the Wazuh manager to apply the changes:
$ sudo systemctl restart wazuh-manager
Test the configuration
Follow the steps below to trigger a load average alert on the Linux endpoint.
Install
Stress, a Linux utility for stress testing:$ sudo apt install stress
Check the number of CPU cores on the Linux endpoint:
$ nprocRun the stress test by executing the command below:
$ stress --cpu <NUMBER_OF_THREADS> –-timeout <DURATION_IN_SECONDS>
Where:
<NUMBER_OF_THREADS>is the number of CPU cores present in the Linux endpoint.<DURATION_IN_SECONDS>is the desired duration of the stress test.
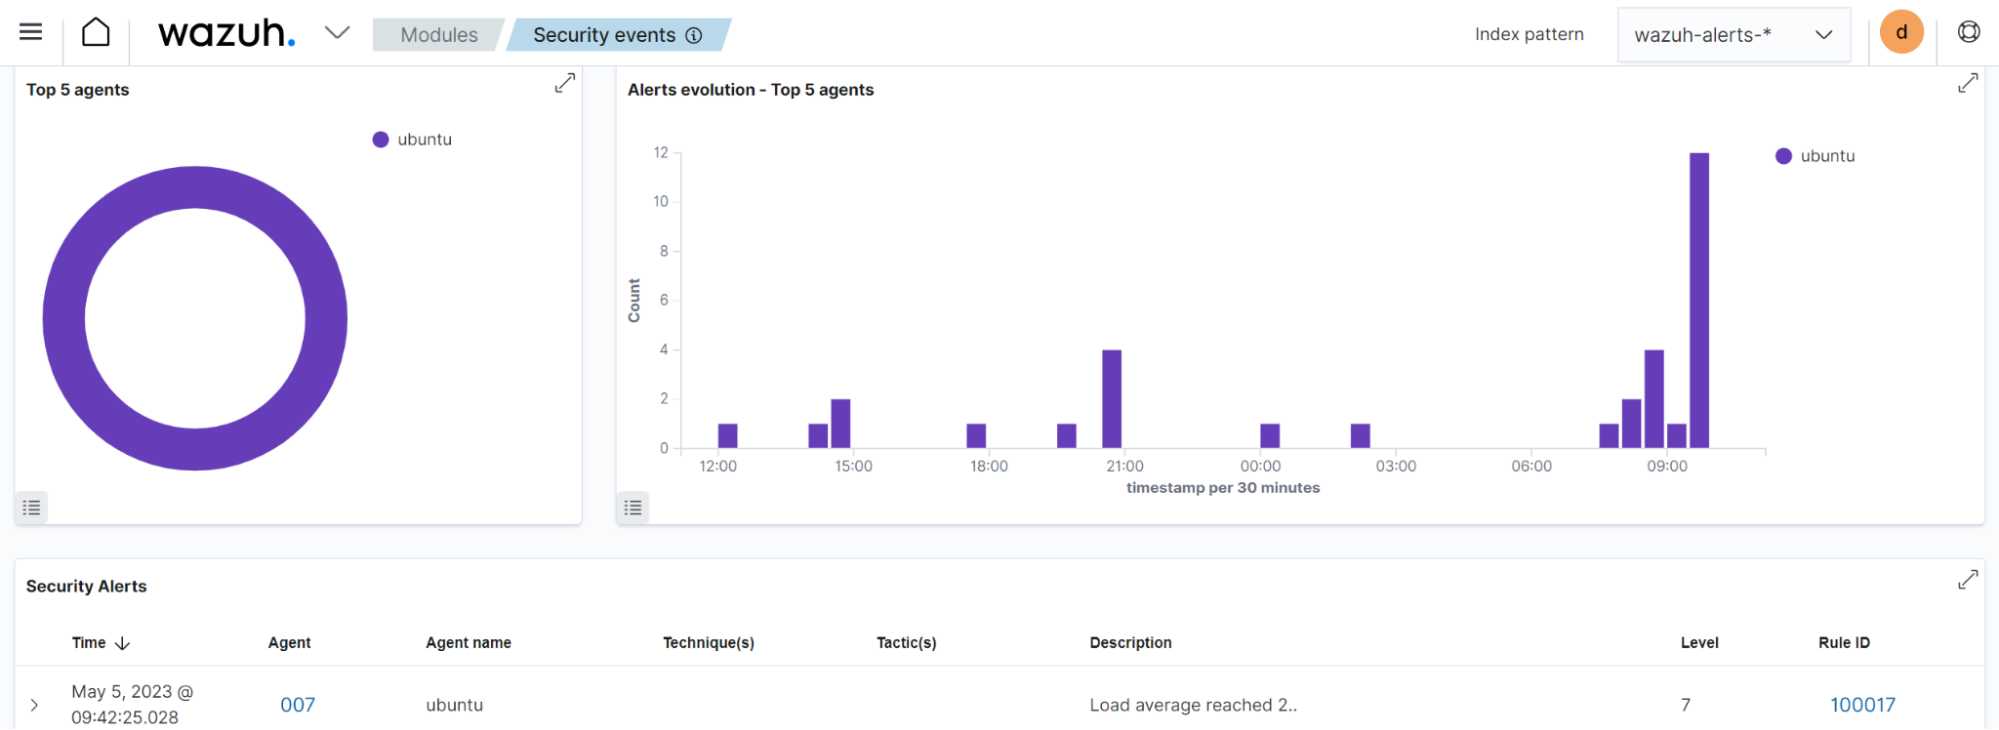
Visualize the alerts
Go to Threat Hunting module on the Wazuh dashboard to visualize the generated alert.