Wazuh global queries
Wazuh global queries allow users to search and visualize global state data directly on the Wazuh dashboard. Global state data represents aggregated information collected from all monitored endpoints, stored centrally in the Wazuh indexer under dedicated indices. This provides a comprehensive view of system configurations, installed software, vulnerabilities, and other critical details.
Previously, users could only retrieve inventory and vulnerability information per agent. With global queries, all relevant data is collected and centralized in the Wazuh indexer. This enables users to view and analyze system inventory and vulnerability information for all monitored endpoints from one single place. This centralization improves monitoring efficiency, streamlines threat hunting, and accelerates incident response.
How it works
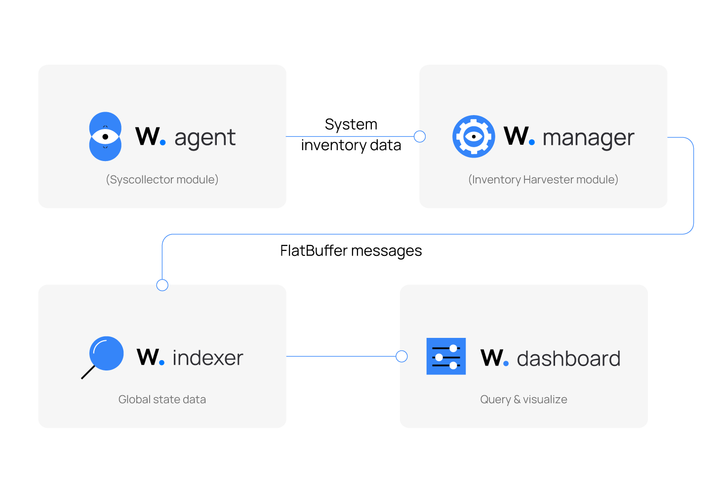
Wazuh agents run modules such as the Syscollector module, which periodically collect system inventory data from monitored endpoints. This includes running processes, network interfaces, software packages, and more.
The Wazuh agents forward this data securely to the Wazuh manager using protocols such as wazuh-remoted and wazuh-db. The Wazuh Inventory Harvester module on the Wazuh manager processes the incoming data and standardizes it using Wazuh Common Schemas (WCS). It then forwards the processed data to the Wazuh indexer, where it is stored as global state data.
This data is stored under dedicated indices for each data type, so users can efficiently run targeted queries and generate visualizations directly on the dashboard. For example, the vulnerabilities inventory is indexed as wazuh-states-vulnerabilities-*. It is also part of the global state data and provides up-to-date information about discovered endpoint vulnerabilities.
The image below illustrates how the Wazuh global queries feature works.
Wazuh Inventory Harvester module
The Wazuh Inventory Harvester module on the Wazuh manager processes the collected data in sequential steps:
Message ingestion: The Wazuh manager receives data from the Wazuh Syscollector module via the wazuh-remoted and wazuh-db protocols. These messages are transformed into FlatBuffer messages, a compact format designed for fast and efficient communication between Wazuh components for processing.
Deserialization and validation: The FlatBuffer messages are converted into native data structures and validated against the Wazuh Common Schema (WCS). This ensures all data maintains a consistent structure, format, and integrity.
Batching and forwarding: The validated data is grouped into batches for performance. These batches are forwarded in bulk from the Wazuh manager to the Wazuh indexer for storage.
Storage: The data is stored in a dedicated global state index for each data type, following Wazuh Common Schemas (WCS). This logical separation allows for efficient and targeted queries.
Monitoring and feedback: The module reports any indexing issues or failures for retries or error handling.
Indexing
The Wazuh indexer organizes global state data into indices, each representing a category of information collected by Wazuh modules. These indices enable precise queries and visualizations in the Wazuh dashboard. The global state data indices are outlined below:
Index Pattern |
Description |
|---|---|
|
Basic information about hardware components on a monitored endpoint. |
|
Updates installed on a Windows endpoint. |
|
Status and packet transfer information for network interfaces. |
|
IPv4 and IPv6 addresses for each network interface. |
|
Currently installed software packages on an endpoint. |
|
Open network ports on a monitored endpoint. |
|
System processes running on a monitored endpoint. |
|
Network routing configuration details and protocols per interface. |
|
Operating system, hostname, and architecture on an endpoint. |
|
Information about vulnerabilities detected on a monitored endpoint. |
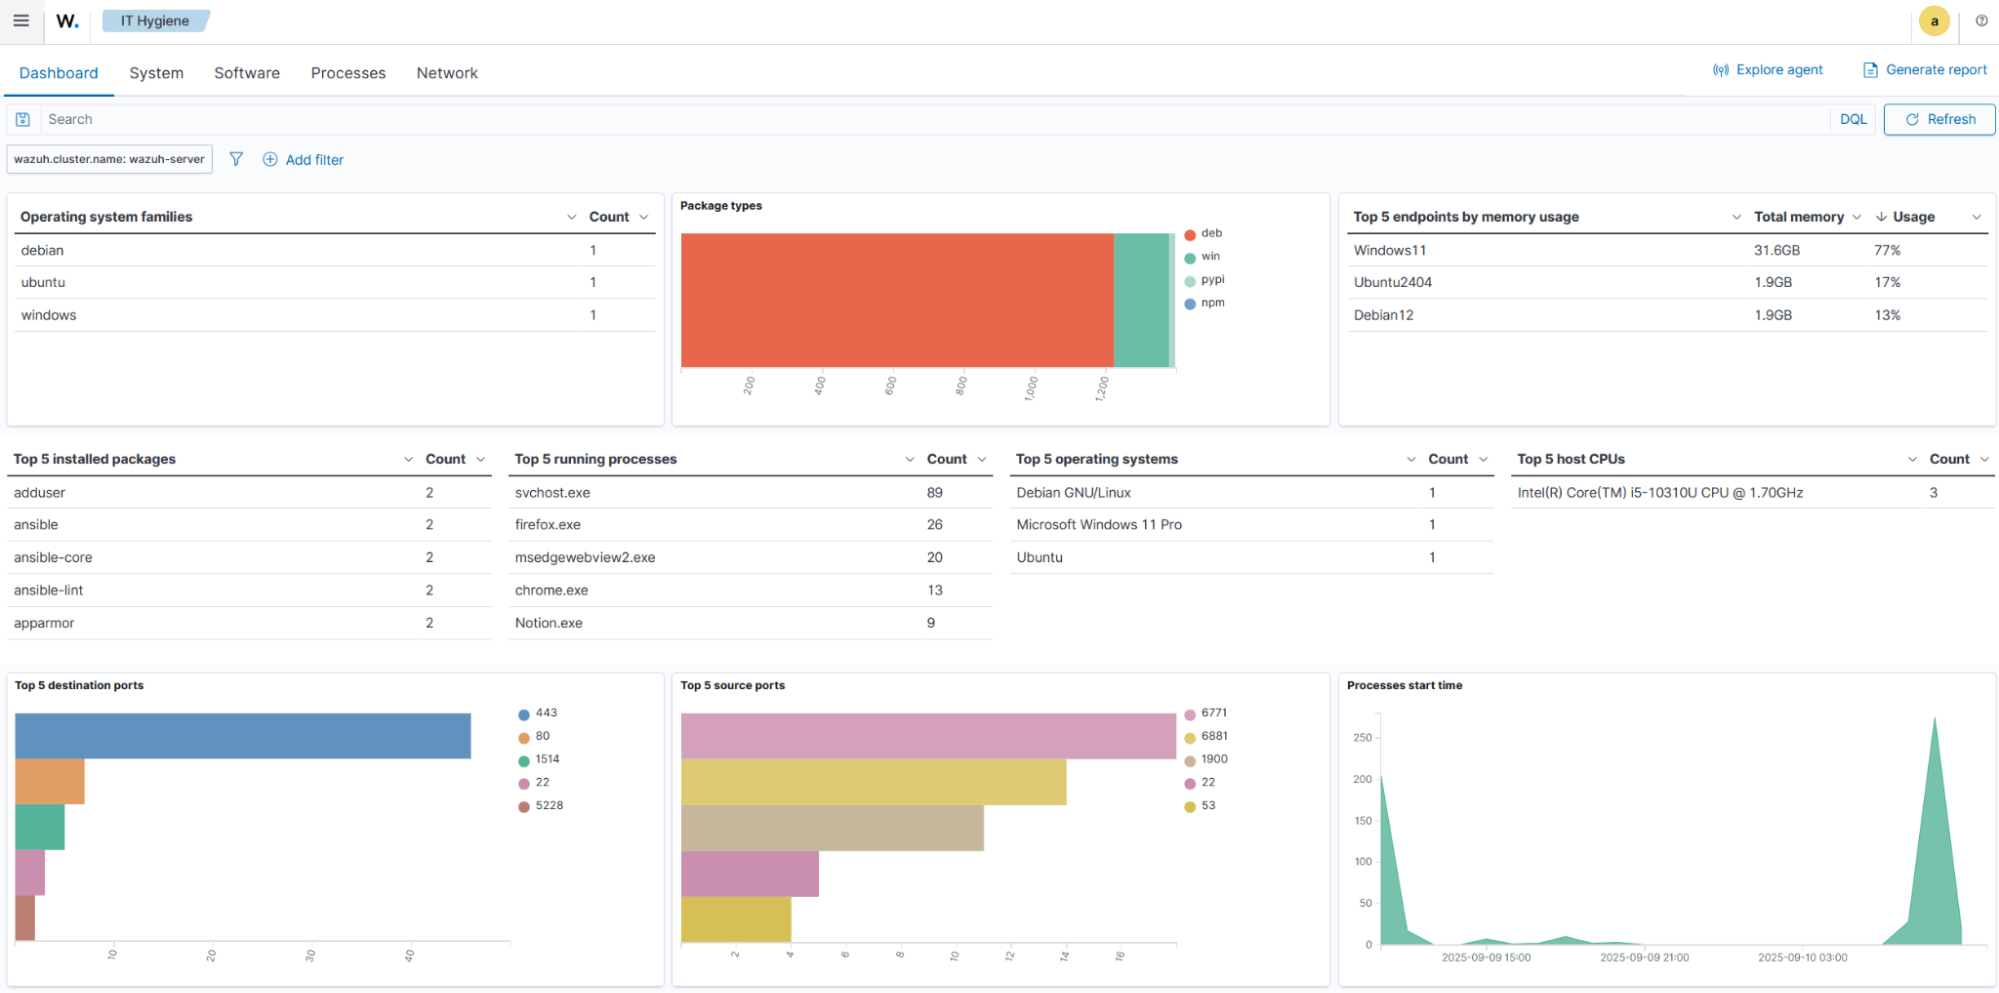
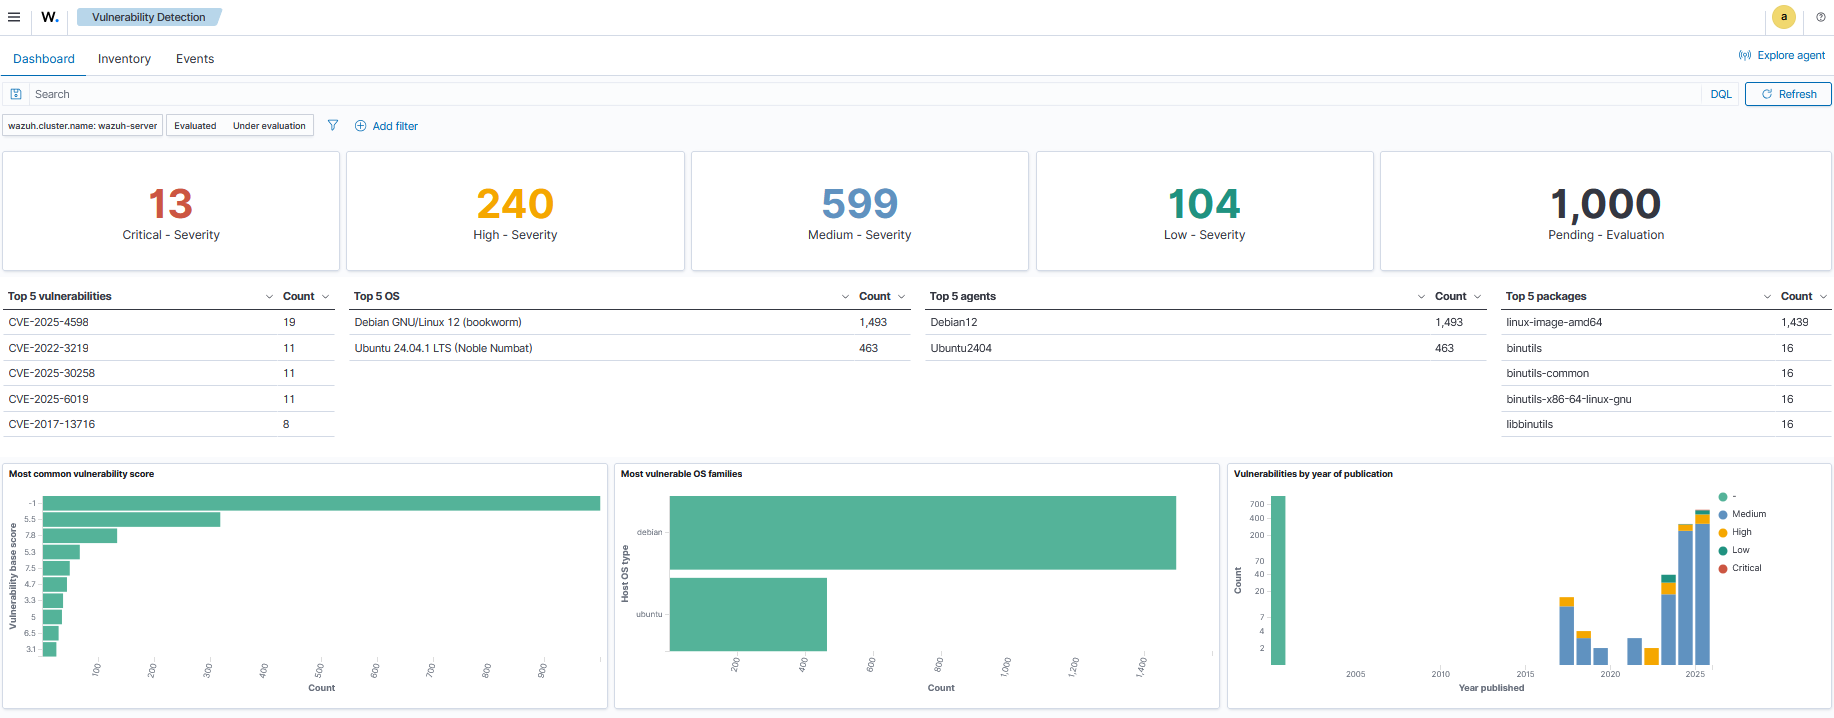
Querying and visualization
Users can query and visualize global state data directly from the Wazuh dashboard. The centralized and enriched index structure enables prompt reporting, compliance checks, and detection of risks across the environment.